Crypto paper trading simulator
AlphaProve runs your crypto trading strategy on live market data with simulated money. Use it to observe a saved or built-in strategy after backtesting: watch its trades, positions, equity and drawdown as new data arrives. Runs are hosted and continue when you close the browser.
No exchange account, API key or deposit is needed for paper trading, and no real orders are placed. Simulated results do not predict live returns; the fill model and data limitations below matter when comparing results.
Markets and timeframes
Paper trading covers five Bybit USDT perpetual markets:
| Market | Symbol |
|---|---|
| Bitcoin | BTCUSDT |
| Ether | ETHUSDT |
| Solana | SOLUSDT |
| XRP | XRPUSDT |
| Dogecoin | DOGEUSDT |
Supported strategy timeframes are 1m, 5m, 15m, 1h, 4h and 1d. The run setup is populated from current market-data coverage and shows which symbol/timeframe combinations are available. These are perpetual-contract simulations, not spot purchases.
Cost and private-beta access
Paper trading is included in the Free tier after private-beta approval. Free allows 1 concurrent run and 1 start per day; Trader allows 5 and 5; Quant allows 10 and 10. See pricing for plan details and the limits below for how starts are counted.
AlphaProve is in private beta. Requesting access does not open the workspace immediately: new requests need approval before you can sign in and start a run.
See a paper run
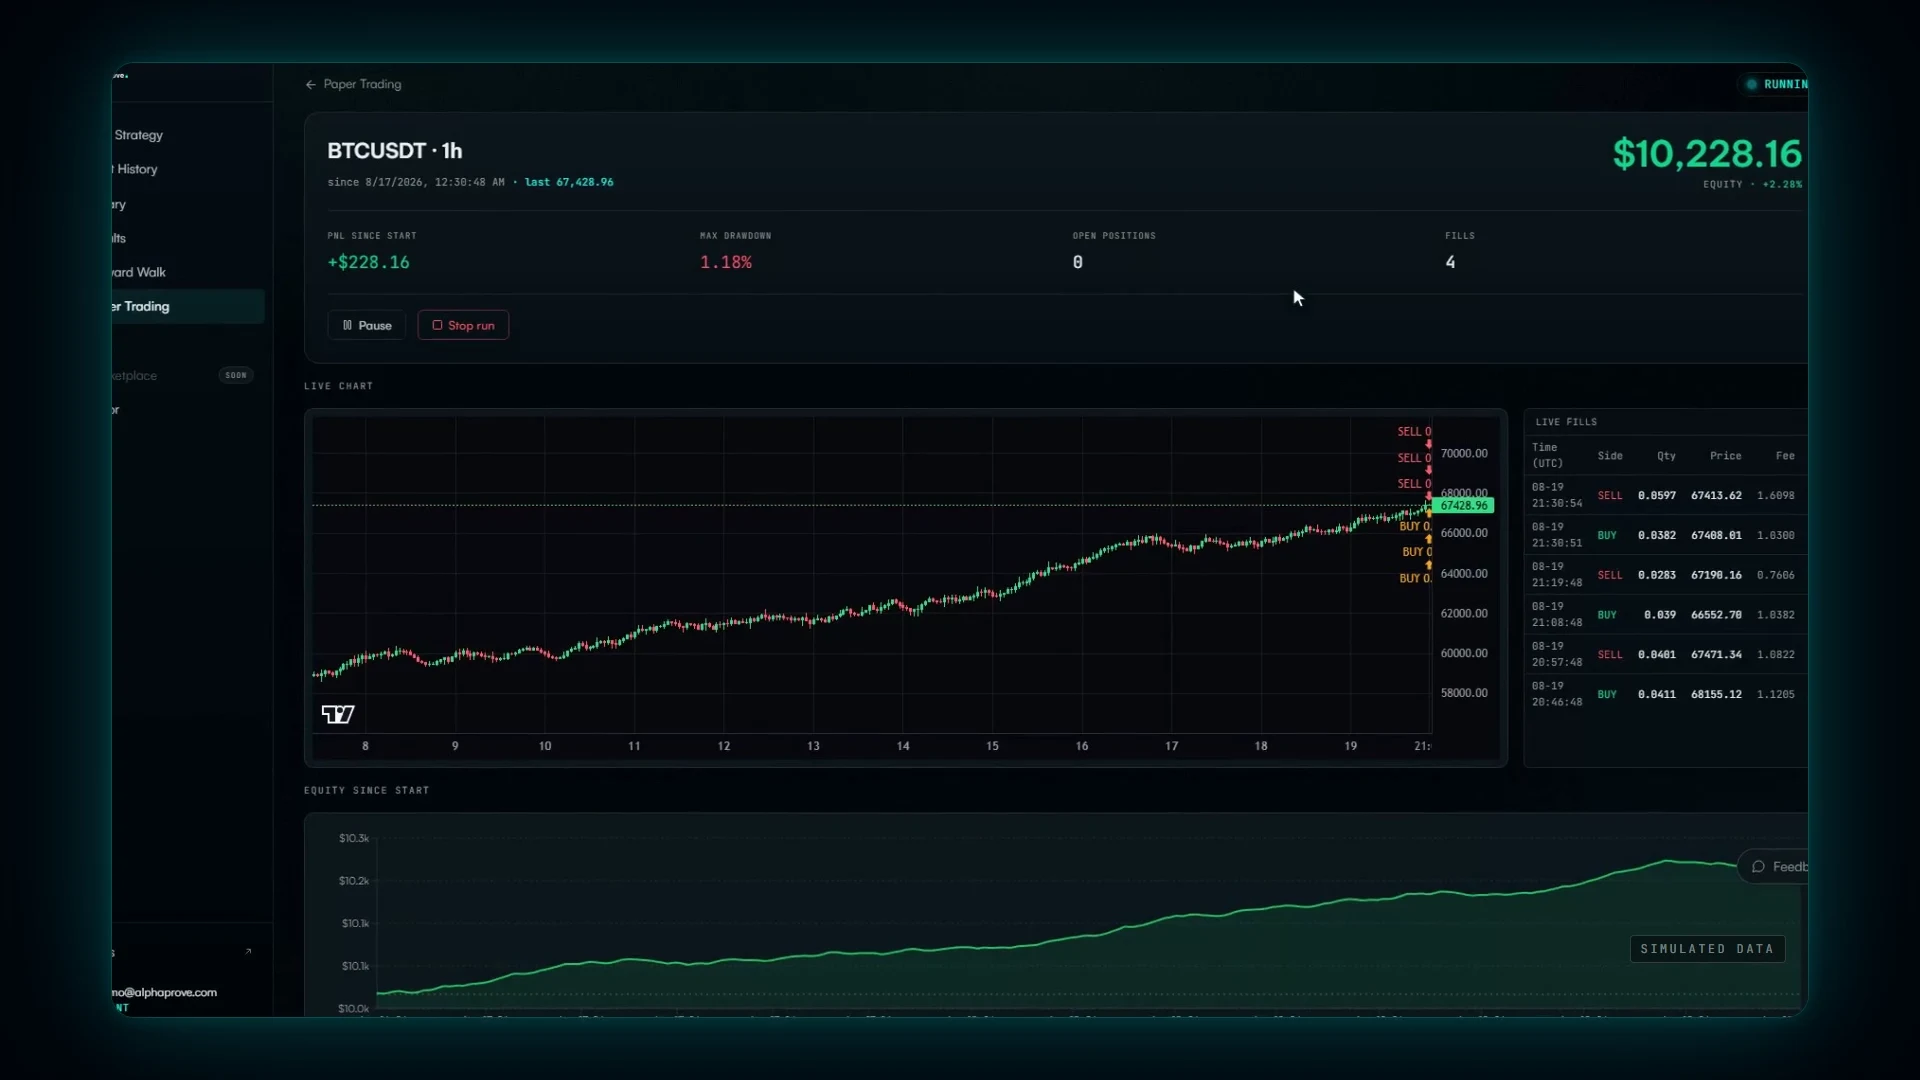
Product screenshot from AlphaProve's scripted demo, using simulated example data. The balances, trades and returns shown are illustrative, not results from a live strategy or a performance claim.
Starting a run
Start from the Library — every strategy row's menu has a Paper trade action — or from the Paper Trading page's Start paper trading button (which can also run the built-in strategies). Pick:
- Symbol and timeframe — from the markets we have live data for.
- Initial capital and leverage — simulated, of course.
- Risk settings — the same sizing methods, drawdown kill-switch, and dynamic-risk options a backtest accepts.
- Run for — an optional end period. The run stops itself when it expires; you can stop it earlier at any time.
Once accepted, the run warms up from historical data and then processes new closed bars. The first update depends on the selected timeframe and data availability; an hourly strategy may wait for the next hourly close.
Example: a one-day Bitcoin paper run
After your beta access is approved:
- Open Paper Trading, choose Start paper trading, and select a saved strategy or one of the available built-ins.
- Select BTCUSDT and 1h. Set simulated initial capital to 10,000 USDT and leverage to 1×.
- Set Run for to 24 hours, review the strategy's risk settings, then choose Start paper trading.
- Review the chart, positions and fill feed as hourly bars close. When the run stops, read its Paper performance report, including fees and maximum drawdown. A strategy may produce no trades in this period.
These settings demonstrate setup; they are not a strategy recommendation or enough evidence to judge profitability. Stopping early still consumes that day's start.
Watching it live
The run page is a live view:
- The price chart updates in place — the forming candle moves with the live market price (trade-speed when the exchange stream is available, a few seconds' cadence otherwise), and closed bars append as they complete. The live price feed is display-only; simulated fills use the paper run's recorded execution data and fill model.
- Fills appear on the chart and in the feed as they happen, so you see exactly when the strategy opens and closes positions.
- The stats block tracks equity, PnL since start, max drawdown, and open positions, updating on every processed bar. Fill totals, fees, and maximum drawdown are maintained for the entire run even when the browser only loads a recent chart window.
- When a run stops, the Paper performance report records final equity, net PnL, return, maximum drawdown, fill count, fees, and duration. These are simulated results, not a forecast of live performance.
Leaving the page (or closing the browser) does not affect the run — it executes server-side and is exactly where you left it when you come back.
Run states
| State | Meaning |
|---|---|
| Running | Trading normally, evaluating each bar as it closes. |
| Paused | You paused it. Any open positions are closed at the last simulated price and open orders are cancelled, so nothing trades while paused. Resume continues from the present — the paused period is never traded. |
| Catching up | The processing loop briefly fell behind (deploy, data-feed gap). Your run is fine — it replays the missed bars exactly as if live, then returns to Running. |
| Stopped | You stopped it, or its end period expired. Any open positions are closed at the last simulated price, so the final report is fully realized. Final stats stay available. |
| Error | The strategy raised repeatedly and the run was halted. The error message is shown on the run page. |
After an outage, the worker catches up by replaying available missed bars in bounded batches; a long gap may take several ticks. If data for a bar arrives only after the run has advanced past it, that late bar is skipped. A paper run can therefore differ from a backtest that uses data loaded later.
Limits
Concurrent runs and daily starts are limited per tier: Free 1 running / 1 start per day, Trader 5 / 5, Quant 10 / 10. A start that the server rejects (validation, coverage) refunds the day's start; stopping a run yourself does not.
Paper runs also bound the amount of state they rebuild. A strategy may require at most 20,000 primary-timeframe bars of warm-up after all declared higher-timeframe views are converted to the primary timeframe. Strategies above that limit are rejected before the run starts, with the limiting history view named in the error. This keeps expensive multi-timeframe strategies from consuming unbounded worker memory or CPU.
Catch-up is deliberately incremental. One tick processes at most 500 primary bars and at most 20,000 one-minute fill bars; higher timeframes use a smaller primary batch when necessary to stay inside the fill budget. A long outage can therefore take several ticks to recover. During catch-up, available closed bars inside the selected horizon are replayed from the saved cursor; bars that arrive only after the cursor has passed them are not replayed. (Pauses are different: resuming skips the paused period entirely instead of replaying it — you paused precisely so the strategy would not trade that window.)
How paper fills differ from backtests
Paper trading and historical backtests use the AlphaProve engine and simulated funds, but their trades and results are not guaranteed to match even with the same strategy and settings. Paper consumes incoming market data and resolves orders using the execution mode shown on the run page:
- One-minute fills are the default. Orders resolve against closed 1-minute candles, even when the strategy evaluates on a slower timeframe. Backtests use L2 order-book fills where book data exists, falling back to the 1-minute candle model where it does not; this can produce different prices and stop/target ordering.
- Trade-tick fills may be enabled for new runs in some deployments. The run page labels these separately; orders resolve against recorded market trades rather than 1-minute candles.
- Timing and data. Paper evaluates a strategy after each selected bar closes, once that data is available. A bar may arrive a few seconds after its close. If a market-data revision arrives after paper has advanced past that bar, it is skipped rather than replayed; a historical backtest can use data loaded later.
Both modes use simulated fees, slippage, sizing, brackets, funding and liquidation rules. Funding events are processed once in timestamp order, and strategy code receives the latest observed funding context after restarts. These shared rules do not provide fill-by-fill or performance parity with a backtest or an exchange.